Supporting Fact Library Graphics
Supporting graphics you can download and use.
Diagnosis
Note: This section contains facts for four groups: Children (ages 0-14), Children and Adolescents (ages 0-19), Adolescents (ages 15-19), Adolescents and Young Adults (Ages 15-39)
- Childhood and Adolescent cancer (ages 0-19) is not one disease - there are more than 12 major types of pediatric cancers and over 100 subtypes.1 Centre international de recherche sur le cancer, Organisation mondiale de la santé, eds. Paediatric Tumours. 5th ed. International agency for research on cancer; 2022.
- One in 264 children & adolescents is estimated to be diagnosed with cancer before the age of 20 years.2 Siegel RL, Kratzer TB, Giaquinto AN, Sung H, Jemal A. Cancer statistics, 2025. CA Cancer J Clin. 2025;75(1):10-45. doi:10.3322/caac.21871
- The average age at diagnosis is 10 overall (ages 0 to 19), 6 years old for children (aged 0 to 14), and 17 years old for adolescents (aged 15 to 19)3Howlander N, Noone A, Krapcho M, et al. SEER Cancer Statistics Review, 1975-2018. Based Novemb 2020 SEER Data Submiss. Published online April 2021. https://seer.cancer.gov/archive/csr/1975_2018/index.html, while adults’ median age for cancer diagnosis is 66.4 Age and Cancer Risk. Natl Cancer Inst. 2021;SEER 21 2013–2017, all races, both sexes. https://www.cancer.gov/about-cancer/causes-prevention/risk/age
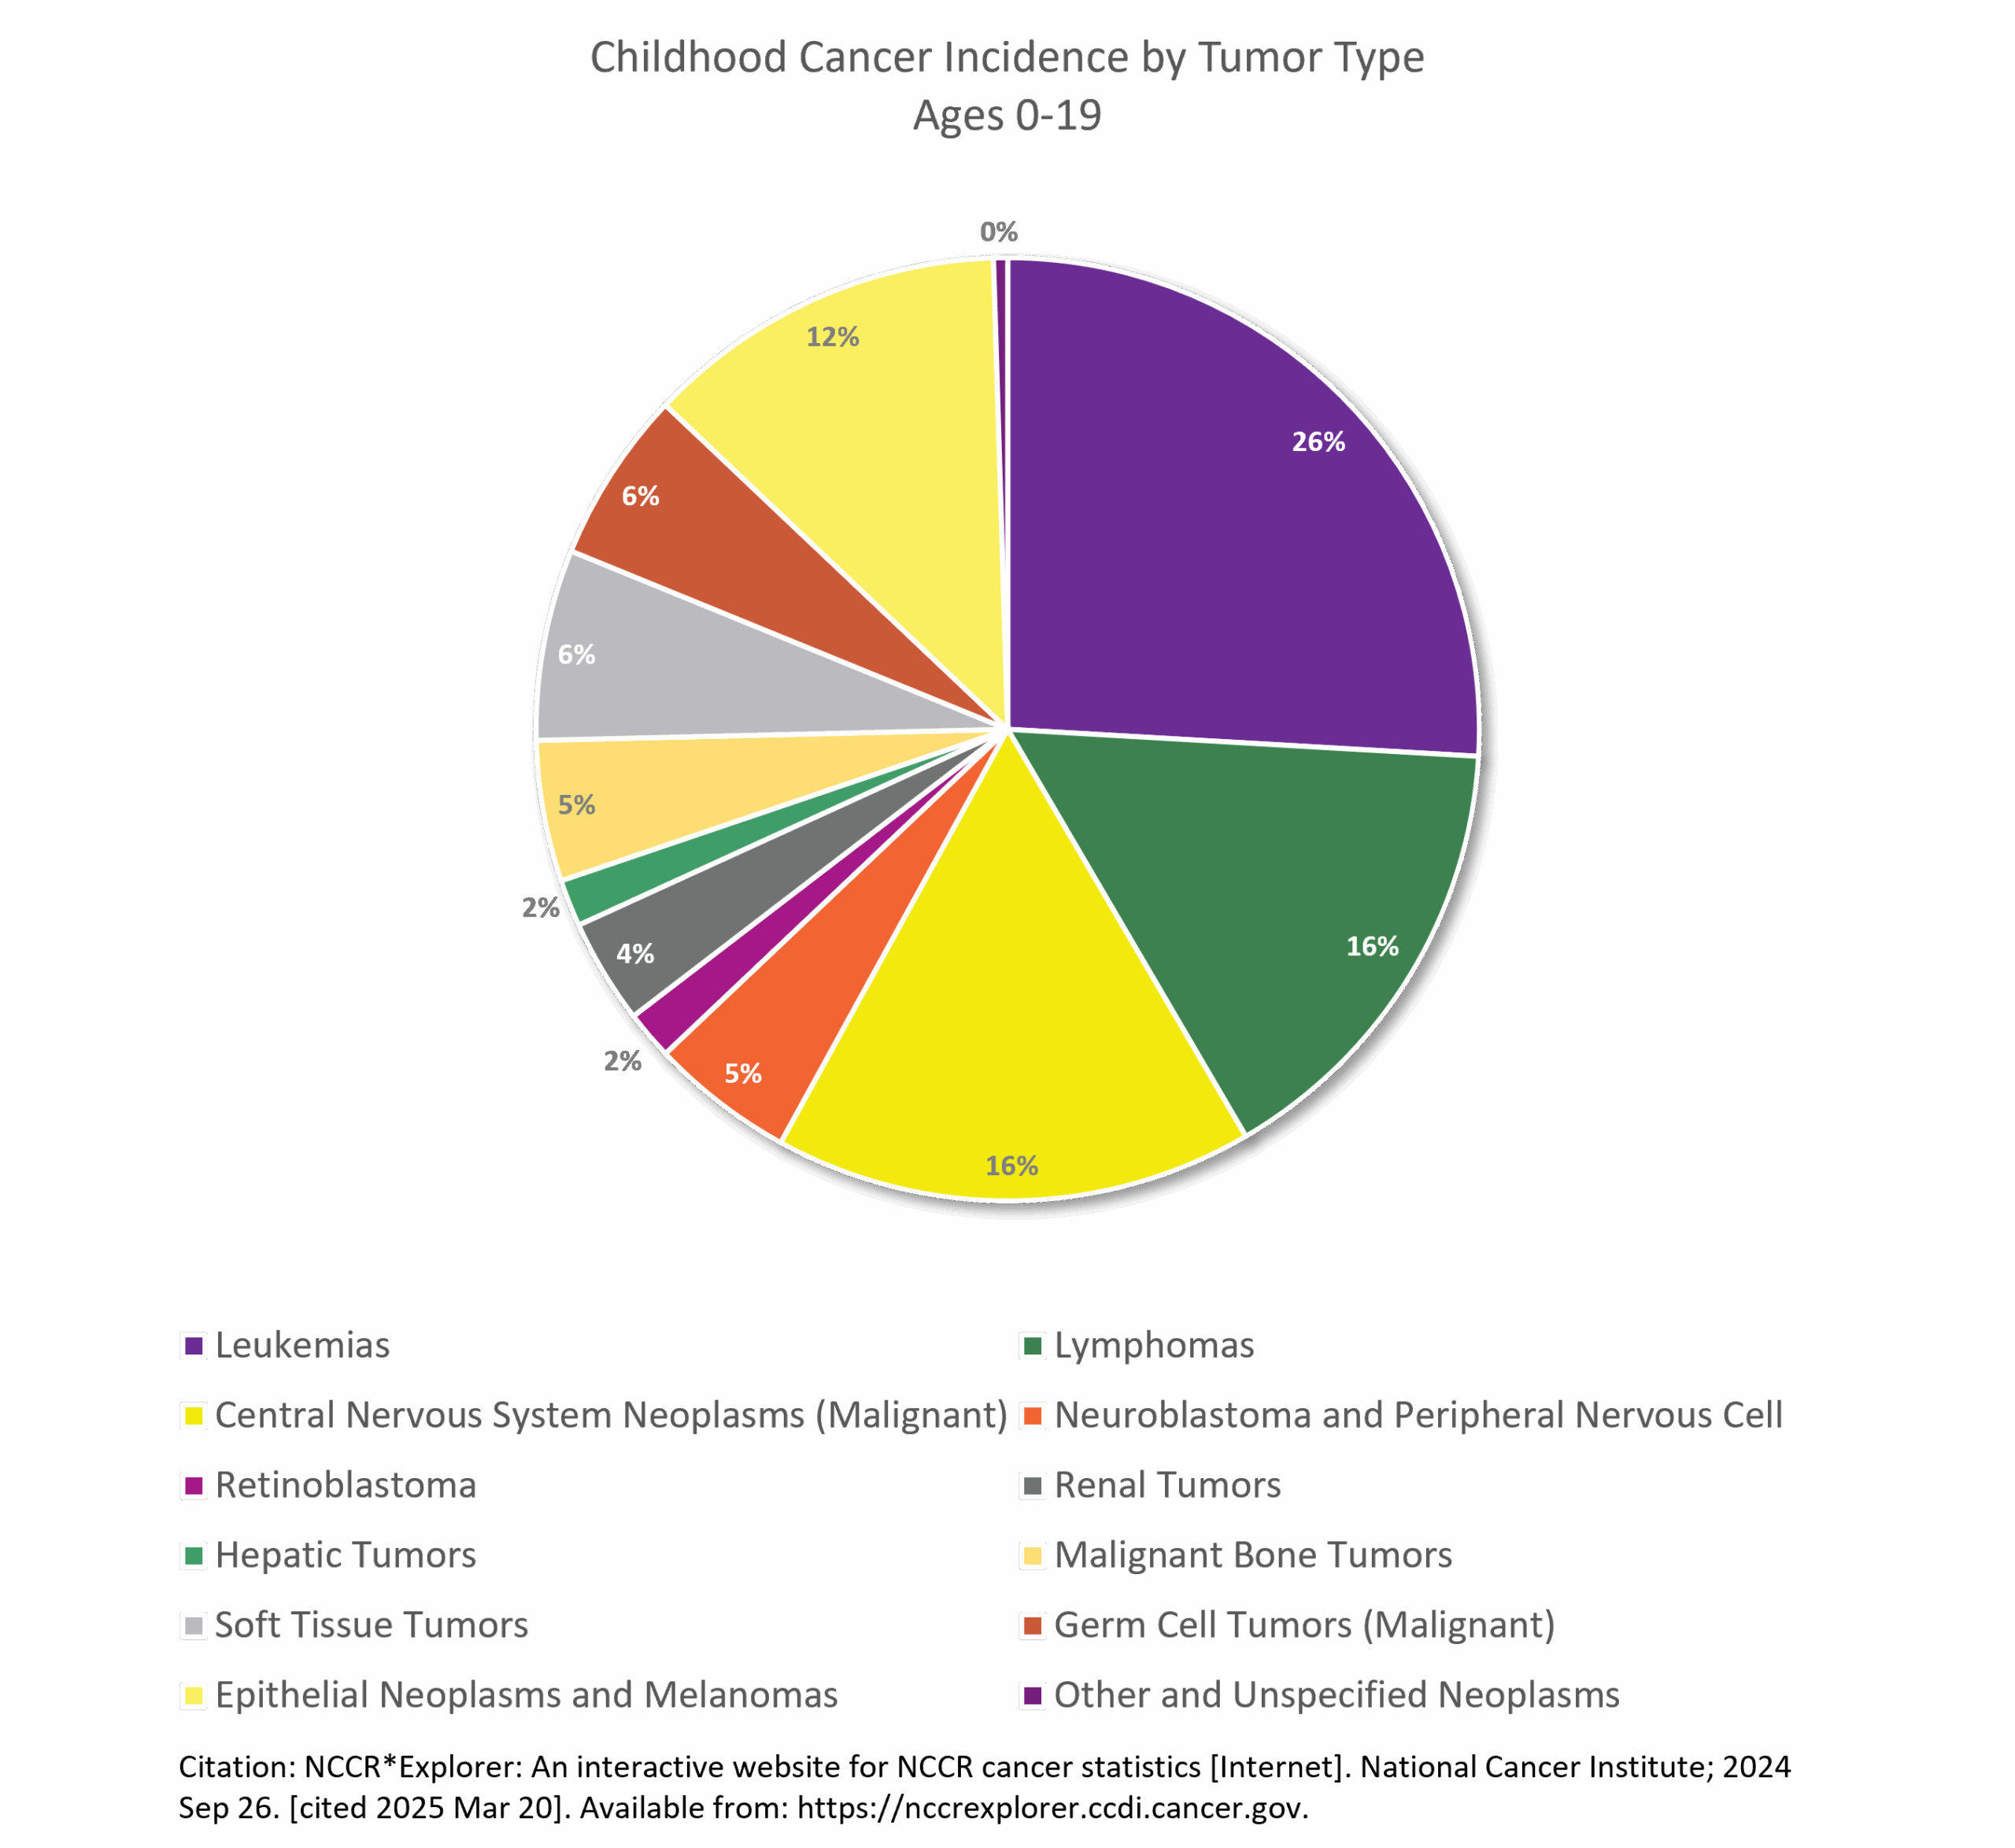
- Leukemia is the most common childhood cancer (ages 0-14), accounting for 28% of cases, followed closely by central nervous system tumors (27%), one-third of which are benign or borderline malignant. In adolescents (ages 15-19), the most common cancer is central nervous system tumors (22%), more than one-half of which are benign or borderline malignant, followed by lymphoma (19%) and leukemia (13%).5 Siegel RL, Kratzer TB, Giaquinto AN, Sung H, Jemal A. Cancer statistics, 2025. CA Cancer J Clin. 2025;75(1):10-45. doi:10.3322/caac.21871
- After increasing since at least 1975, the overall invasive cancer incidence rate in children (ages 0-14), declined slightly from 2015 through 2021 by 0.8% per year driven by a recent rapid decline in malignant brain tumors (from 37.3 per million in 2017 to 31.9 per million in 2021) and stabilized rates of lymphoid leukemia. In contrast, overall incidence continued a slow increase in adolescents (by 0.7% per year) because of climbing rates for both lymphoid leukemia and non-Hodgkin lymphoma. Malignant brain tumors decreased rapidly, consistent with the pattern in children, but represent only 9% of all malignancies versus 20% in children.6Siegel RL, Kratzer TB, Giaquinto AN, Sung H, Jemal A. Cancer statistics, 2025. CA Cancer J Clin. 2025;75(1):10-45. doi:10.3322/caac.21871
- In 2025, an estimated 9550 children (aged birth to 14 years) and 5140 adolescents (aged 15–19 years) will be diagnosed with cancer.7Siegel RL, Kratzer TB, Giaquinto AN, Sung H, Jemal A. Cancer statistics, 2025. CA Cancer J Clin. 2025;75(1):10-45. doi:10.3322/caac.21871
- Approximately 5.7% of newly diagnosed brain tumors, including adults, occur under age 20.8Ostrom QT, Price M, Neff C, et al. CBTRUS Statistical Report: Primary Brain and Other Central Nervous System Tumors Diagnosed in the United States in 2015–2019. Neuro-Oncol. 2022;24(Supplement_5):v1-v95. doi:10.1093/neuonc/noac202
- Childhood brain and other nervous system cancers are most frequently diagnosed among ages 5–9.9Cancer Stat Facts: Childhood Brain and Other Nervous System Cancer (Ages 0–19). SEER 12. Published online 2024. https://seer.cancer.gov/statfacts/html/childbrain.html
- Children with Down syndrome are 10 to 20 times more likely to develop leukemia than children without Down syndrome.10Cancer in Children and Adolescents. Natl Cancer Inst. Published online September 27, 2023. https://www.cancer.gov/types/childhood-cancers/child-adolescent-cancers-fact-sheet
First time Cancer Diagnosis for Adolescents and Young Adults (AYA’s) Ages 15 to 39
- In 2023, it is estimated that there will be 85,980 new cases of cancer among AYAs in the United States. 11 Cancer Stat Facts: Cancer Among Adolescents and Young Adults (AYAs) (Ages 15–39). Natl Cancer Inst. Published online 2022. https://seer.cancer.gov/statfacts/html/aya.html
- Overall cancer incidence rates for AYAs increased an average of 0.9% per year between 2014 and 2018. The overall cancer incidence rate was 77.9 cases per 100,000 persons. 12 Cronin KA, Scott S, Firth AU, et al. Annual report to the nation on the status of cancer, part 1: National cancer statistics. Cancer. 2022;128(24):4251-4284. doi:10.1002/cncr.34479
- The most common cancer among AYAs was female breast cancer, which was highest among Black AYAs. 13 Cronin KA, Scott S, Firth AU, et al. Annual report to the nation on the status of cancer, part 1: National cancer statistics. Cancer. 2022;128(24):4251-4284. doi:10.1002/cncr.34479
Long Term Health-Effects Associated with Treatments & Survival
- Childhood cancer is not one disease – there are more than 12 major types of pediatric cancers and over 100 subtypes.14 American Cancer Society, Childhood and Adolescent Cancer Statistics, 2014 https://www.cancer.org/content/dam/cancer-org/research/cancer-facts-and-statistics/annual-cancer-facts-and-figures/2014/special-section-cancer-in-children-and-adolescents-cancer-facts-and-figures-2014.pdf
Funding
There are two conflicting reporting methods available that are used to gauge federal childhood cancer research investment. A report used in the past and often cited by advocates, is the National Cancer Institute’s Funded Research Portfolio (NFRP)(7C) below. It indicates that from 2008 through 2018, the NCI spent an average of 4.08% of its obligations on childhood cancer research. According to NCI’s Office of Advocacy Relations (OAR), the NFRP does not reflect NCI’s total investment in any one particular area of research—including childhood cancers—because it does not account for basic science awards, which are not categorized by cancer type and which may have applications to multiple types of cancer.
| YEAR | TOTAL BUDGET NCI FUNDING | CHILDHOOD CANCERS FUNDING | PERCENT |
|---|---|---|---|
| 2008 | $4,827,552,152 | $189,672,374 | 3.93% |
| 2009 | $4,966,926,530 | $192,844,826 | 3.88% |
| 2010 | $5,098,146,876 | $197,126,947 | 3.87% |
| 2011 | $5,058,104,978 | $195,529,112 | 3.87% |
| 2012 | $5,066,969,036 | $208,070,156 | 4.11% |
| 2013 | $4,789,897,881 | $185,134,664 | 3.87% |
| 2014 | $4,932,807,990 | $203,716,485 | 4.13% |
| 2015 | $4,951,675,428 | $205,060,620 | 4.14% |
| 2016 | $5,206,169,249 | $506,767,589 | 3.97% |
| 2017 | $5,636,393,224 | $220,273,687 | 3.91% |
| 2018 | $5,937,729,104 | $302,325,670 | 5.09% |
| TOTAL | $56,470,372,448 | $2,306,522,130 | 4.08% |
About the NCI Funded Research Portfolio
The NCI Funded Research Portfolio (NFRP) web site contains information about research grants, contract awards, and intramural research projects funded by the National Cancer Institute. The NFRP provides access to various NCI budget reports that contain information about research funding according to specific research categories. It also provides the ability to search the database in various ways, including text searching of project abstracts and the ability to search the NIH research categories that are assigned to projects carried out by extramural and intramural groups.15National Cancer Institute, NIH/NCI https://fundedresearch.cancer.gov/nciportfolio/about.jsp
How does NCI generate NFRP funding data?
At the close of each fiscal year, NCI asks each of its scientific organizations to report their research funding according to specific research categories. The reports that NCI intramural and extramural programs provide are then combined to determine the NCI funding totals for individual research areas. The total research funding for each category is reviewed and verified before NCI publishes on the NCI web site, Cancer.gov.16National Cancer Institute, NIH/NCI https://fundedresearch.cancer.gov/nciportfolio/about.jsp Unfortunately, the present Research Portfolio only has been completed through 2018. By now, it should have been completed through 2020. NCI stated they were working on it.
What is scientific coding?
Scientific coding refers to the categorization of research projects according to scientific focus. In this process, research projects are analyzed and classified according to scientific topic and content. Scientific coding allows the development of science-based budget information, which can be used in portfolio analysis to examine the distribution of funds across research areas. Scientific coding is also necessary to answer inquiries about the scientific and budgetary aspects of Institute-funded research. NCI employs a sophisticated system of scientific coding in which trained professionals and/or scientific staff analyze grant applications, contracts, and intramural projects to classify each project for its degree of relevance to Special Interest Category (SIC) and Organ Site (SITE) codes. This coding structure is meant to describe in a consistent way the major scientific disciplines requested by NIH, DHHS, Congress, and the public. A critical characteristic of coded data is comparability from one fiscal year to the next. This process allows the Institute to respond quickly to requests for information from NCI staff and the broader community. The coding definitions used by the NCI intramural program are consistent with those used for extramural grants and research and development (R&D) contracts to maintain accuracy across the Institute’s portfolio. 17National Cancer Institute, NIH/NCI https://fundedresearch.cancer.gov/nciportfolio/about.jsp
Another report, preferred by OAR, is the NIH RePORTER, which is a congressionally mandated system all NIH Institutes and Centers (ICs) use to report data by fiscal year (FY). This tool highlights annual support for various research, condition, and disease categories (RCDC) based on grants, contracts, and other funding mechanisms used across NIH.
| Fiscal Year | NCI Pediatric Cancer $ Amount | Total NCI Obligations | % of Total Obligations |
|---|---|---|---|
| 2016 | $289,845,271 | $5,206,169,272 | 5.57% |
| 2017 | $351,782,326 | $5,636,392,678 | 6.24% |
| 2018 | $413,099,150 | $5,927,729,104 | 6.97% |
| 2019 | $437,681,409 | $5,992,439,908 | 7.30% |
| 2020 | $502,159,184 | $6,383,348,911 | 7.87% |
| 2021 | $565,721,399 | $6,442,735,236 | 8.78% |
According to OAR, like the NFRP, the NIH RePORTER also does not account for the totality of NCI’s investment in a given area of research because basic science awards cannot be categorized by individual cancer type. Using Total NCI Obligations, without making allowances for NIH items included in the Pediatric Cancer Amount, would distort the percentage of Total Obligations.
While both of the above reports, The NFRP and the NIH RePORTER, seem unable to capture a completely accurate measure of childhood cancer research expenditure as it relates to total research dollars, perhaps a better method to measure progress may be to compare NIH RePORTER pediatric dollars (c) to the Total NIH Dollars (d) for each fiscal year. This method would show changes from one year to the next. Note that the chart below shows that the pediatric cancer expenditures are growing from 2016 to 2021.